|
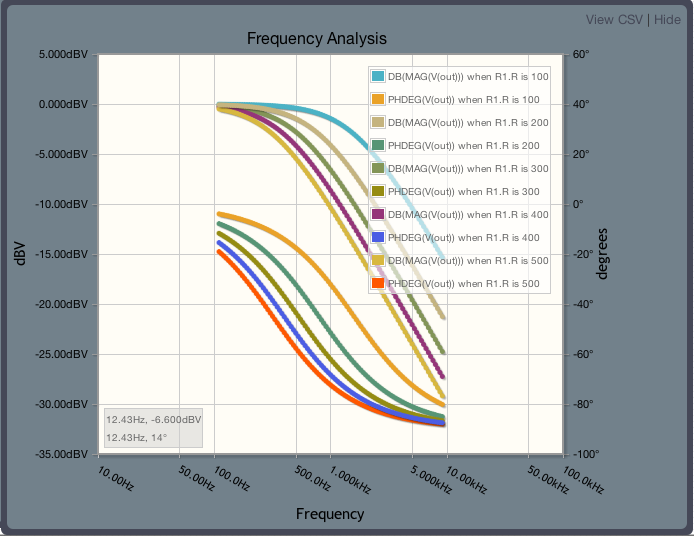
I noticed that every time I did an AC sim, the results are plotted log frequency (Good choice for default.) If I plot a sweep from 50 Hz to 8kHz, I get a nice plot that spans 10Hz to 10kHz, spanning an integral number of decades (also a fine default). But if I sweep 100Hz to 10kHz, instead of plotting the two decades of interest, the plot opens up to 10Hz-100kHz, with a blank decade of plot at each end. Even if I pull the endpoints to within these decades, e.g. 110Hz - 9.35kHz these blank decades are added:
|
")
March 14, 2012 |
|
Sorry, I meant to point to the example schematic I used for this, though it does not seem dependent on the schematic. And FYI, I did this in Safari under OSX 10.7, verified behavior in Chrome.
|
March 14, 2012 |
Please sign in or create an account to comment.

CircuitLab is an in-browser schematic capture and circuit simulation software tool to help you rapidly design and analyze analog and digital electronics systems.
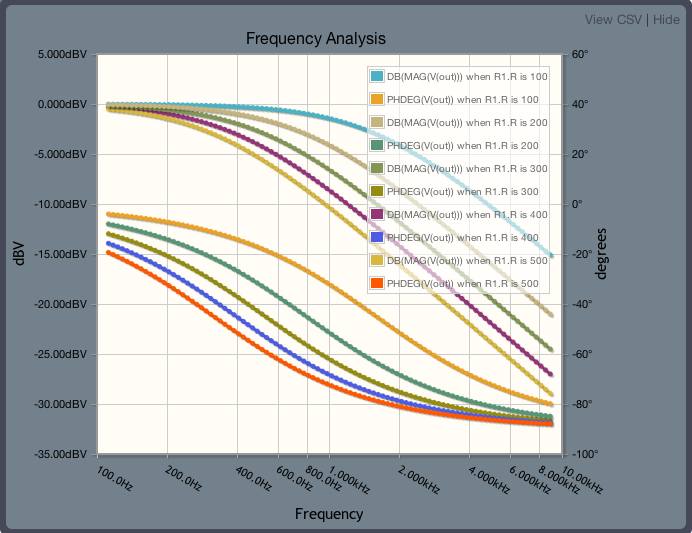
 Going just a bit further, and reducing my sweep to 112Hz-9.31kHz, I get the plot window one would expect:
 This seems a straightforward issue to not expand the plot window until the sweep goes beyond the decade boundary.