There is no tradeoff between saving lives and saving the economy. I analyze the COVID-19 pandemic as a feedback control system from an engineering perspective, and show something surprising: the shape of the policy frontier is concave down, like an inverted parabola, so that in one region of the curve, it’s not a zero-sum game. It’s optimal to both save lives and save the economy at the same time.
This presentation is primarily available as a video. A transcript and links are below.
You may open and run the simulation in your browser:
In the video, we show adjusting the TARGET_R_E parameter between 0.6 and 1.3.
In this presentation, I’ll analyze the COVID-19 pandemic as a feedback control system from an engineering perspective, and show something surprising: we don’t necessarily have to make any tradeoff between saving lives and saving the economy.
That’s because the shape of the policy frontier is concave down, like an inverted parabola, so that in one region of the curve, it’s not a zero-sum game. It’s optimal to both save lives and save the economy at the same time. This might be counterintuitive, but if you stick around, I’ll explain why in three parts:

We’re still in the early days of this thing, and there are a wide range of final outcomes. The strategy decisions we make -- and I don’t just mean government policy -- I mean behavior of all of us, the public at large -- these decisions have a huge effect on how much economic and human harm we endure over the full course of this virus. I’m going to jump into the details now. If the math doesn't interest you, feel free to skip it, but I’ll try to be brief.
This video only has the potential to influence behavior if it goes viral faster than the virus does. So if you’re not going to stick around for the details, please send this video to a friend with an engineering, math, science, computers, economics, or business background in your life, because I think they’re going to enjoy the next few sections. Let’s jump into part 1, “Simulating the Pandemic and Public Policy as a Feedback System.”
There are a bunch of models being published that take the last few weeks of infection and death data and project into the future. My favorite model, and probably the most accurate I’ve seen is covid19-projections.com. As of today it estimates that 4.0% of the US population has been infected, and 0.6% are currently infected.
The problem with these forecasts is they don't extend more than a few weeks into the future. That’s because this is a feedback system. Human behavior (aka public policy) influences the spread of the virus; the virus then causes some number of infections and deaths that show up a few weeks later, which in turn affect policy. This makes short-term forecasts inaccurate pretty quickly.
Instead of making short-term projections from recent data, I’ve built a model of a system with the virus and public policy working in a closed feedback loop. This is a classic engineering problem that we know how to simulate and analyze over a wide range of possible feedback parameters. The parameters we’re going to vary here aren’t about the virus itself, because that’s fairly well understood, but instead they’re parameters about people’s reaction to the virus. The benefit of my approach is that it lets us simulate the range of possible outcomes all the way from now until the time that we hopefully get a vaccine.
It assumes that we humans will adjust behavior, for example, to prevent the hospital system from being overwhelmed. I think that’s a pretty good assumption, so I’ve built that into my feedback loop. I also think that policymakers will generally target overall stability in new case numbers or perhaps some slight controlled growth or decline, so I’ve built that into my feedback system as well.
Here’s my model: I’ve built this in my circuit simulator because I’m an electrical engineer and it turns out that it’s really easy to model an epidemic with four capacitors and three current sources.
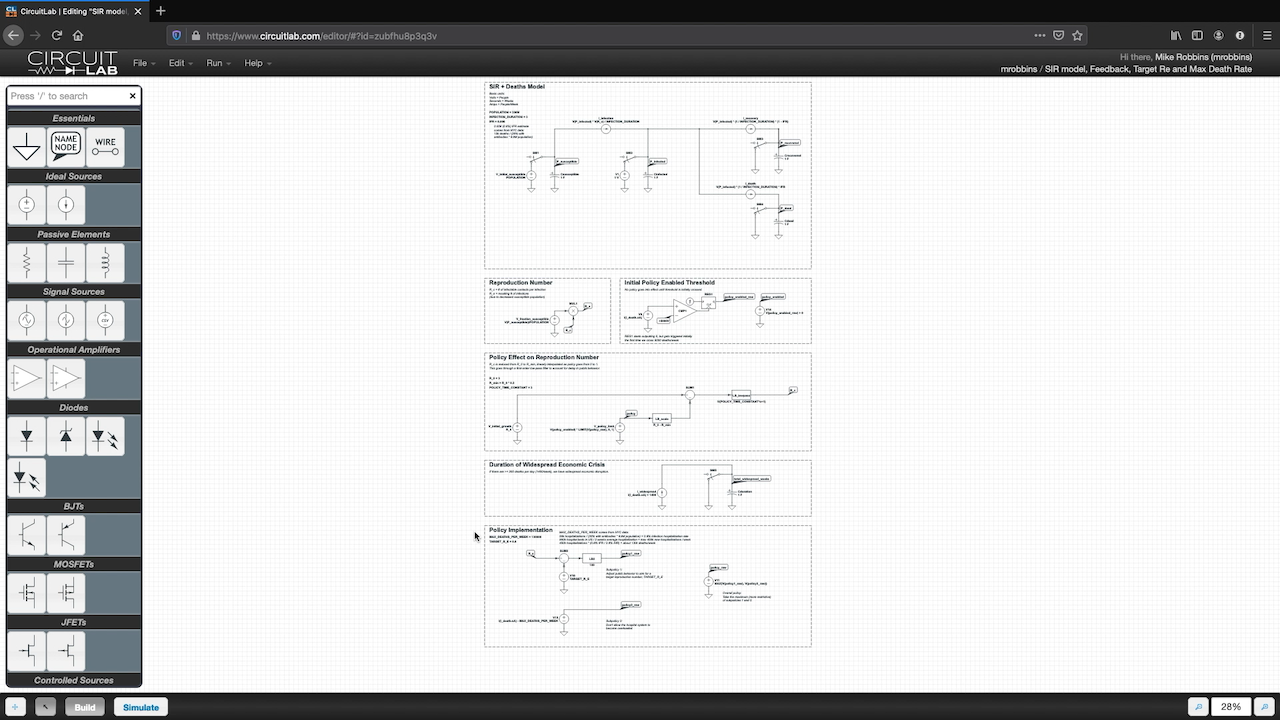
1 Coulomb of charge represents 1 person, and current of 1 Amp represents a flow of 1 person per week from one condition to another. The capacitors store that charge and convert it to a voltage we can measure, and the current sources move people from one bucket to another.
This is the standard epidemiological SIR model. S is for susceptible. Initially the entire population is susceptible since it’s a novel virus. I is for infected or infectious, and we start with just one initial case at time zero. R is for recovered people who can no longer be infected. We also include a category for deaths based on a 0.8% estimated infection fatality rate.
The current sources move people, or charge, from one bucket to another at rates that are defined by these algebraic expressions. For example, you get exponential growth at the beginning of an epidemic because the rate at which people are becoming newly infected is proportional to the number of people already infected. It’s also proportional to R_e, the effective reproduction number -- the number of new infections on average for every current infection. Fortunately, even if infected people make the same number of contacts, the effective reproduction number will drop over time, because the fraction of the population that’s susceptible is declining.
There are a few other details to show about my model. We have a section down here with our feedback policy, that outputs a voltage called policy_raw. Policy is going to be a number between 0 and 1, where 0 is our ordinary behavior back in 2019, and 1 means we’re doing absolutely everything humanly possible to prevent new infections. My assumption here is that this policy variable causes a reproduction contact rate to decline from R_0=3 to 20% of that, or 0.6; basically I’m saying that at most, we can cut infectious behavior by 80%.
I also run this through a first-order low-pass filter with a time constant of 3 weeks because it takes a few weeks to change people's behavior.
There is also a switch that turns on the policy after we first cross 5000 deaths/week. This basically mirrors what’s actually happened so far in the US. This creates a binary variable called policy_enabled, 0 or 1, which gets multiplied in down here.
Because I want to measure the economic impact and not just the death count, I’m keeping track of the duration of the crisis. I’ve defined a widespread economic crisis as more than 200 deaths/day, or 1,400/week in the US. At the time of recording, we're at roughly 10,000 deaths/week.
This is a core point so I’ll elaborate a bit. It makes sense to define the duration of widespread economic crisis in terms of the number of deaths per day for two reasons: First, as deaths-per-week declines toward this threshold, the absolute level of risk starts to be similar to car crashes and the flu, so people will be more willing to resume more and more everyday activities while keeping some new safety precaution still in place. Second, and more important, is that there is a point at which we have a phase change from a widespread problem to a small number of localized problems.
Right now, we have to make policies like closing all schools and offices because there are so many new infections per day that anyone could be infected. But once the absolute number falls enough, there are few enough cases that we can start to make more selective policies. If we have a small enough number of new cases that we can do contact tracing and selective isolation, we can open up more things for non-infected people and maintain the same average reproduction number.
As the absolute number of new cases per day goes down, we can maintain the same average level of vigilance but direct it more narrowly, meaning we can loosen restrictions on most of the population. That kind of localized vigilance with broader reopening is dramatically different than the widespread economic crisis that we have now. It's not going to be perfect, it's still going to suck, we're going to be wearing masks for a while. But closing down one or two schools occasionally as cases are discovered is much better than widespread closures. I'm defining the widespread closures like we have today as the duration of the widespread economic crisis.
If you want to save the economy, you want to get into that localized control mode as soon as possible, and that means reducing the absolute level of deaths per day.
And last of all, we get to the policy implementation itself. This a description that takes inputs of what’s going on with the virus, and uses it to set the policy. The policy sets R_c, the reproduction contact number, which sets R_e, the effective reproduction number, which determines the course of the virus, creating a fully closed-loop system.
I’ve defined a policy that takes the maximum value of two subpolicies, which means that it takes the stricter of the two rules.
Subpolicy number 1 is feedback around R_e, the effective reproduction number. Many health agencies and websites are trying to estimate that number based on case data, but it’s ultimately a number that describes whether new cases and deaths are flat [with R_e=1], growing [with R_e > 1], or shrinking [with R_e < 1]. I assume that policymakers target a specific R_e value called TARGET_R_E. If the real value is below that, this subtraction and multiplication provides a strong feedback signal to allow reopening, and vice-versa.
Subpolicy number 2 is to keep the death rate under MAX_DEATHS_PER_WEEK. This value was set based on an estimate of the total hospital bed capacity of the US, as well as the average duration of hospitalization, and converting that to a number of deaths per week that barely uses 100% of the hospital capacity of the country. Because we have two policies, one will dominate at any time. For example, if we pick a target R_E > 1, we’ll eventually grow the number of cases and infections to a point where it just starts to saturate the hospital system, but at that point, policy #2 will kick in and add restrictions which decrease R_E to 1, holding at exactly that maximum death capacity.
OK, that took a while to explain, but now that we’ve built the model we can just hit “Simulate” and “Run Time Domain Simulation” and see what happens.
Here’s a link to my simulation in case you want to try it yourself right in your browser or even change it however you like.
OK so we get 4 charts out of our simulation. The first one shows the number of people in each bucket by week. This one has 357.9 thousand people dead by the end of the simulation. The second chart shows the currents through different current sources on a logarithmic scale.

This grey line is the number of deaths per week, and you can see it peaks around 17 thousand deaths/week. The third plot shows our policy variable in blue, which is how much we need to lock down between 0 and 1. It also shows the reproduction numbers. And the fourth plot shows whether we’re still in the widespread economic crisis. The blue line shows the total length of the crisis, in this case, 47 weeks of widespread economic distress.
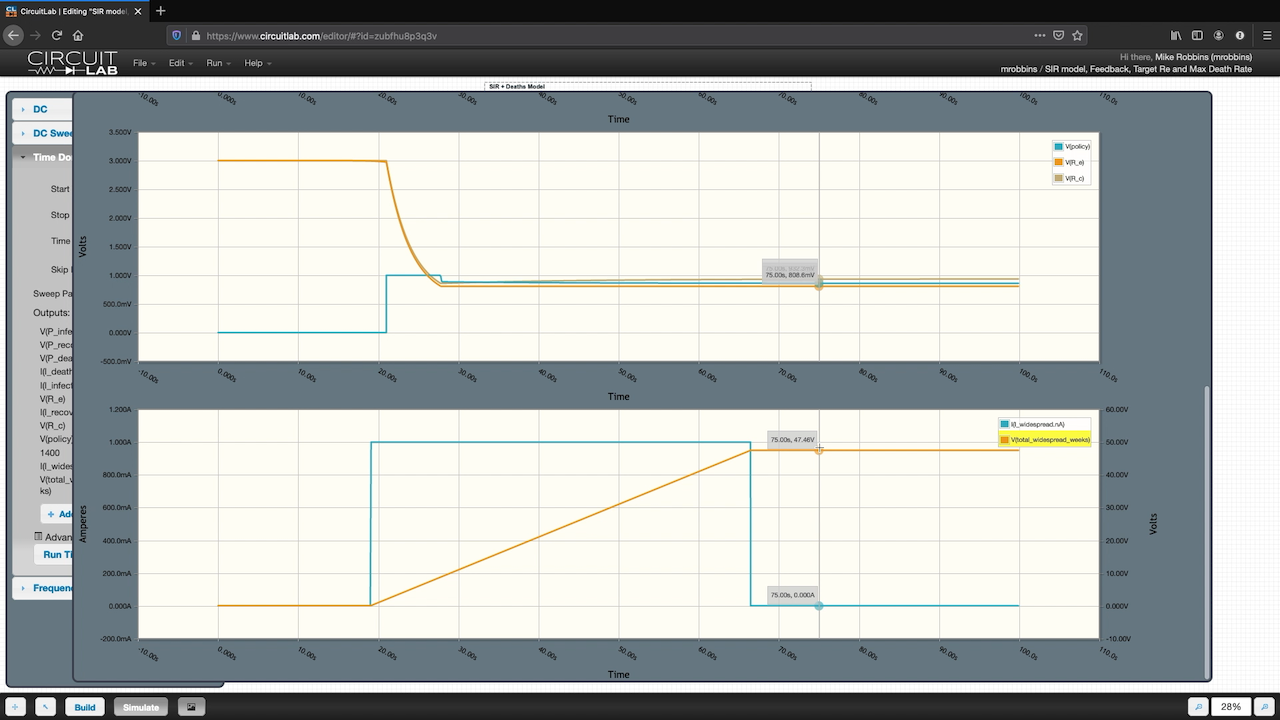
So just to summarize this simulation run, we ran the simulation with TARGET_R_E=0.8, meaning that our policy feedback loop was attempting to make sure that each new infection only resulted in 0.8 new infections. The outputs were 357.9 thousand deaths and 47 weeks duration.
We can run that for different values of TARGET_R_E. Let’s change it to 1.1 and see what happens. Now we get 2.21 million deaths and 75 weeks duration.
So just by changing our policy feedback parameter from 0.8 to 1.1, we get 6 times as many deaths, and an extra 6 months of economic distress. Wait, what? We got more deaths AND a longer duration of economic crisis.
If I run it again with TARGET_RE = 1.0, what happens? You can see now we get a flat-line of deaths per week, as you’d expect for R=1. This time we get an economic crisis that lasts until the end of my simulation, when we hopefully get a vaccine.
Let’s plot these three outcomes with deaths on the x-axis and duration on the y-axis. There’s something interesting going on here. Let’s run more simulations in part 2, plotting the public policy frontier curve.
I ran the simulation for 12 different values of TARGET_R_E from 0.6 to 1.3. Here’s the resulting curve. This has a total number of deaths on the x-axis, and the duration of the economic crisis on the y-axis. We want both to be lower; lower left is better.
Most policymakers have a simple model in their heads that assumes that this curve must have a negative slope. This means can choose to prioritize health outcomes or economic outcomes, but not both.
But this tradeoff concept is not supported by our simulation. That’s just not what the curve looks like.
By simulating the range of possible feedback policies, the curve actually looks concave like this, like an inverted parabola that’s been chopped off on top by hopefully getting a vaccine. This is surprising to most people, it was to me. There are three regions to this curve:

On the right side, there’s a region with a negative slope, where we burn through the population as fast as our hospital capacity allows. In that part of the curve, you do see this tradeoff where infecting faster leads to a shorter economic duration. This comes with horrific death rates, like peak New York City times ten. I believe it’s quite unlikely that we’ll be able to choose policy to operate in this region of the curve -- enough people are personally concerned about their health that public policy won't convince people to sacrifice themselves that fast.
On the left side, there’s a region with positive slope. In this region, we make smart policy choices and educate the public with the goal of reducing the number of transmission events from infected people to not-yet-infected people. Compared to our care-free days, we need to reduce the opportunities for transmission by something like 80%. I think it’s possible that if we just educated 100% of people how to properly wear a mask, that alone might block 80% of transmission events. Combine that with testing, tracing and permissive work-from-home policies, blocking 80% of transmission opportunities doesn’t seem impossible. Just look at New Zealand, South Korea, Taiwan, and China for example. There, the pandemic no longer dominates 100% of news headlines. Yes, they still have to wear masks and change some behaviors, but life is going back to normal, faster, and with far fewer deaths.
The middle region is flat because I chopped it off at the end of our simulation, when I hope, fingers crossed, that there’ll be a vaccine. In this region we see a huge range in the number of deaths, but regardless, we get a prolonged widespread economic crisis until we get a vaccine.
The shape of this curve may surprise you; public discourse is dominated by the right hand side. But by running various closed-loop public policy simulations, we can plot the entire curve and see that we have much better options. That brings us to part 3: minimizing economic and health consequences simultaneously.
The US, at least as of May 2020, is targeting one of the worst case policy points, which isn’t optimal under any reasonable utility function. Currently, policymakers seem to be targeting holding the effective reproduction number right at around 1. If you look at the chart, this is one of the most painful possible policy choices in the long run. It causes both prolonged widespread economic damage, and a ton of unnecessary deaths.
Obviously, we want fewer deaths, and a shorter duration of widespread economic distress. Faced with this graph, it’s obvious that we should move our TARGET_R_E down from 1.0 down to 0.6. This would save 1.2 million lives AND shorten the widespread economic crisis by a year.
The downside is that we have to be smarter about how we reduce disease spread. This does have a cost. You may not be able to go out to a stadium or a concert for a while.
But based on my model, we already have to restrict viral transmission opportunities by about two-thirds just to hold R=1 and prevent overwhelming hospitals. We’ve already accomplished this. You can look at sites like rt.live and epiforecasts.io which forecast what the current reproduction number is. The covid19-projections.com site I mentioned earlier has also added this recently. In all cases, they’re drawing a horizontal line at one, and policymakers seem to be targeting it.
I’d suggest that if we’ve already done a 67% reduction, it may not be that much more of a stretch to reduce transmission opportunities by 73% or 80% instead, resulting in a much better economic and human outcome, saving over a million lives and reducing the duration of economic distress by roughly a year.

This isn't a new idea, but this is the first time I've seen it demonstrated mathematically. It's truly not a zero-sum game. There is no tradeoff between saving lives and saving the economy. And it's not just theoretical; this is what a number of other countries are actually doing successfully today. And they're going to emerge economically a lot sooner than the US will, at a far lower death toll.
We have a public health and macroeconomic crisis with a shortage of strategy, leadership, and long-term thinking. I've applied feedback systems modeling techniques to include public policy reactions. This lets us test different long-term strategies and see the outcomes.
It's counterintuitive, but we've shown there is not a tradeoff between saving lives and saving the economy. The policy frontier curve is concave and has three distinct regions. By deliberately setting a target reproduction number of somewhere around 0.6 to 0.8, we can start to look for the most effective interventions that reduce viral transmission while letting us restore economic activity faster.
And the outcome is dramatically better than the R=1.0 outcome that we're aiming for right now.

This is going to be hard to do because it requires collective action. In my experience, if you want to generate collective action, you first have to come up with a concrete strategy that makes sense, and then you have to have leaders who can step up and communicate that strategy in terms people are ready to get behind. But this really ought to be a strategy that every rational person can get behind, whether you care more about the economic damage or the death toll.
I hope this presentation helps you understand what choices we have about the long-term course of this pandemic. Do not be complacent; there is still a huge range of possible outcomes.
If this analysis was surprising to you, please share this video. We need public health officials, elected officials, the media, and the public at large to understand that the real tradeoffs aren’t what they think they are, and there exist win-win strategies. We just have to be smart enough to see them.
|
Enjoyed the insightful approach! Only critique is that duration may not be the most accurate indicator of economic impact. A world with TARGET_RE of 1.0 may have a faster velocity of money than a world with a TARGET_RE of 0.6, because there is hypothetically less policy hindering interaction. But, if TARGET_RE can be reached in way that doesn't impact money exchange such as just wearing masks then that wouldn't matter. |
May 28, 2020 |
Please sign in or create an account to comment.
CircuitLab is an in-browser schematic capture and circuit simulation software tool to help you rapidly design and analyze analog and digital electronics systems.